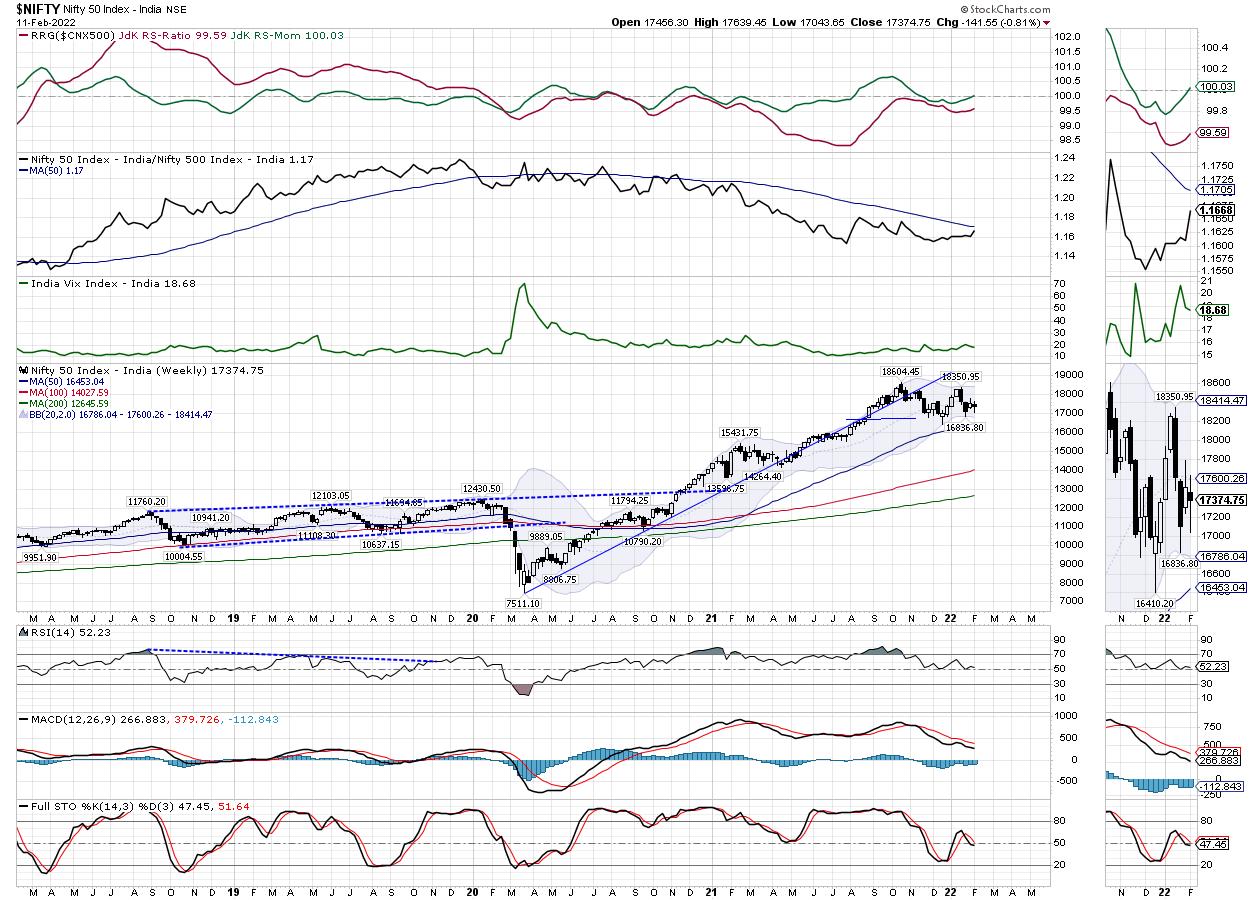
Consolidation continued in the Indian equities; despite a wide trading range and some volatile moves, the markets went on to end with just a modest cut. The NIFTY has resisted the 20-Week MA which presently stands at 17604 in the week before this one, and it also resisted this WMA this week as well. The trading range also remained similar; as compared to 550.05 points in the week before this one, this time, the NIFTY oscillated in 595.80 points while it continued to stay within a broadly defined consolidation range. While a lower top lower bottom was formed on the chart, the headline index closed with a net loss of 141.55 points (-0.81%) on a weekly basis.

There are a few technical developments on NIFTY that need to be taken note of. When it has come to relative performance, the broader markets have been recently outperforming the frontline NIFTY. However, this is likely to change. The RS line of NIFTY against the broader NIFTY500 Index is seen distinctly changing its trajectory and rising higher. More importantly, the NIFTY has rolled inside the improving quadrant of the RRG when benchmarked against the broader NIFTY 500 index. This may potentially end the relative underperformance of this frontline Index; it may also cause the NIFTY to start relatively outperforming the broader markets.
Volatility did not change much; INDIAVIX declined by 1.15% to 18.68 on a weekly basis. The coming week is likely to keep the markets under broad consolidation, but with a neutral to bullish undertone. The levels of 17500 and 17650 will potentially act as resistance points. The supports come in at 17150 and 16900 levels. The trading range is likely to remain similar to what it was over the previous weeks.
The weekly RSI is 52.21; it remains neutral and does not show any divergence against the price. The weekly MACD stays bearish and below the signal line. On the candles, a bearish harami candle has emerged. This has emerged within a consolidation range and therefore does not hold any major significance at the current stage amid the present technical setup.
The pattern analysis shows that the index has been trading in a 2000-odd points wide, but nicely defined consolidation range. This range translates as the zone between 18600 and 16500 levels. Presently, NIFTY is trading above all three key moving averages; but below the 20-Week MA. Given the clearly defined consolidation range, there is nothing on the charts at present that shows any major downsides in the market so long as the index is keeping its head above the 16400 levels.
Overall, NIFTY is likely to see a jittery start to the week; however, it is expected to continue to remain largely in a defined consolidation range. The jitters in the markets are likely to affect all sectors; however, the groups like Oil & Gas, PSU Banks, select other financial stocks, Auto, and few Pharma stocks are likely to post resilient performance. It would be wise to avoid shorts so long as the index is defending key levels. In event of any downside moves, these opportunities may be best utilized in picking up select stocks. While keeping overall leveraged exposures low, a cautiously positive outlook is advised for the coming week.
Sector Analysis for the coming week
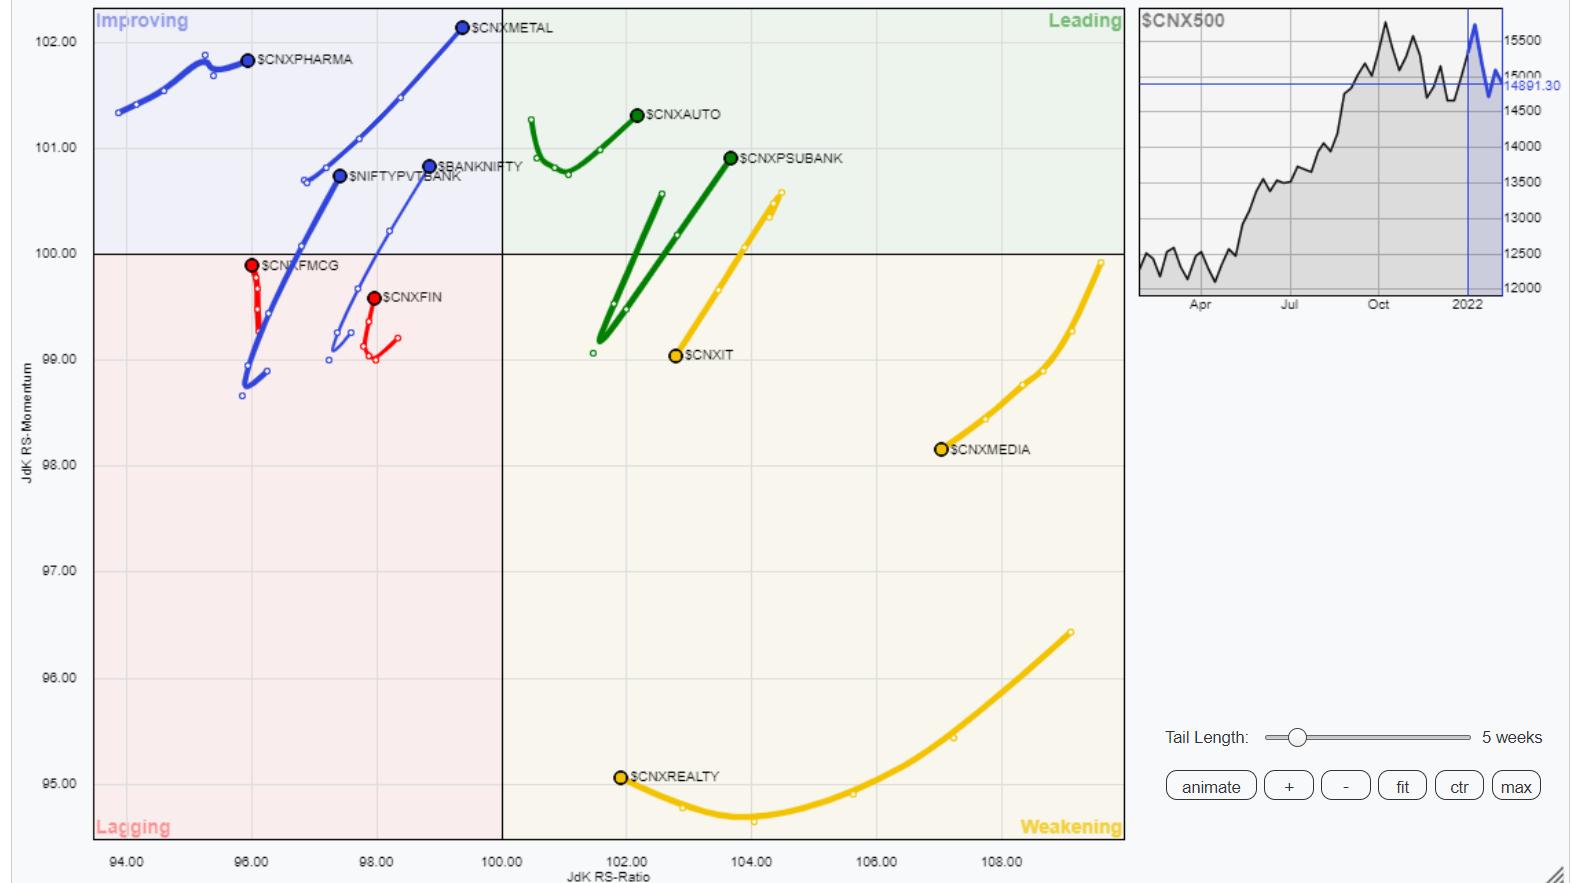
In our look at Relative Rotation Graphs®, we compared various sectors against CNX500 (NIFTY 500 Index), which represents over 95% of the free float market cap of all the stocks listed.

The analysis of Relative Rotation Graphs (RRG) shows the Auto Index, Commodities, PSE, and PSU Bank Indexes firmly placed inside the leading quadrant. The Energy Index is also inside this quadrant; all these groups are likely to relatively outperform the broader NIFTY 500 Index.
The IT and the Realty indices are inside the weakening quadrant along with the Infrastructure and the MidCap 100 index.
NIFTY FMCG, Consumption, and the Financial Services Sector Index are inside the lagging quadrant; however, all of them are showing improvement in the relative momentum against the broader markets. They remain in the process of completing their consolidation phase.
NIFTY Bank, Pharma, and the Metal indices are inside the improving quadrant and they may continue to show resilient performance against the broader markets.
Important Note: RRG™ charts show the relative strength and momentum for a group of stocks. In the above Chart, they show relative performance against NIFTY500 Index (Broader Markets) and should not be used directly as buy or sell signals.
Milan Vaishnav, CMT, MSTA
Consulting Technical Analyst