On COVID (focus on hospitalizations and deaths):
 Click on graph for larger image.
| COVID Metrics | ||||
|---|---|---|---|---|
| Now | Week Ago |
Goal | ||
| Percent fully Vaccinated | 64.2% | — | ≥70.0%1 | |
| Fully Vaccinated (millions) | 213.1 | — | ≥2321 | |
| New Cases per Day3 | 247,319 | 444,473 | ≤5,0002 | |
| Hospitalized3 | 105,449 | 131,099 | ≤3,0002 | |
| Deaths per Day3🚩 | 2,404 | 2,334 | ≤502 | |
| 1 Minimum to achieve “herd immunity” (estimated between 70% and 85%). 2my goals to stop daily posts, 37-day average for Cases, Currently Hospitalized, and Deaths 🚩 Increasing 7-day average week-over-week for Cases, Hospitalized, and Deaths ✅ Goal met. |
||||
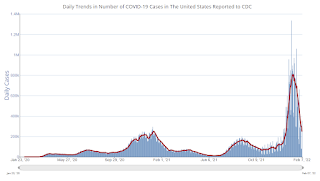
Click on graph for larger image.
This graph shows the daily (columns) and 7-day average (line) of positive tests reported.
New cases and hospitalizations are now declining.