On daily deaths: Just over a month ago, the 7-day average for daily COVID deaths was around 180. Since then, the 7-day average of daily deaths has tripled, and since deaths lag hospitalizations, it seems likely daily deaths will double again. Be careful!
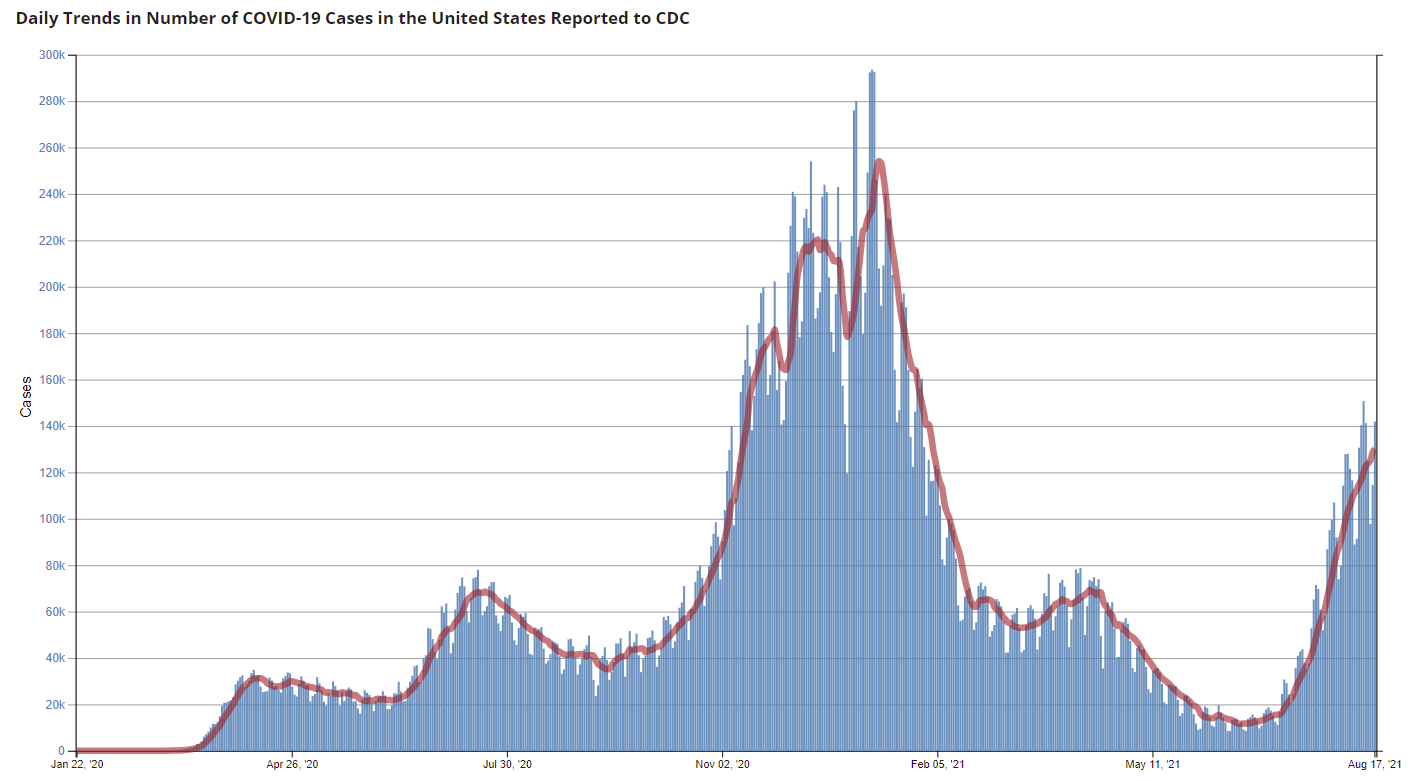
The 7-day average cases is the highest since February 2nd.
The 7-day average hospitalizations is the highest since February 10th.
The 7-day average deaths is the highest since May 13th.
This data is from the CDC.
According to the CDC, on Vaccinations.
Total doses administered: 358,599,835, as of a week ago 353,205,544. Average doses last week: 0.77 million per day.
| COVID Metrics | ||||
|---|---|---|---|---|
| Today | Yesterday | Week Ago |
Goal | |
| Percent fully Vaccinated |
51.0% | 50.9% | 50.3% | ≥70.0%1 |
| Fully Vaccinated (millions) |
169.2 | 168.9 | 167.1 | ≥2321 |
| New Cases per Day3🚩 |
130,121 | 128,508 | 114,963 | ≤5,0002 |
| Hospitalized3🚩 | 74,602 | 73,099 | 59,800 | ≤3,0002 |
| Deaths per Day3🚩 | 554 | 534 | 520 | ≤502 |
| 1 Minimum to achieve “herd immunity” (estimated between 70% and 85%). 2my goals to stop daily posts, 37 day average for Cases, Currently Hospitalized, and Deaths 🚩 Increasing 7 day average week-over-week for Cases, Hospitalized, and Deaths ✅ Goal met. |
||||
IMPORTANT: For “herd immunity” most experts believe we need 70% to 85% of the total population fully vaccinated (or already had COVID).
KUDOS to the residents of the 6 states that have achieved 60% of total population fully vaccinated: Vermont at 67.1%, Massachusetts, Maine, Connecticut, Rhode Island and Maryland.
The following 18 states and D.C. have between 50% and 59.9% fully vaccinated: New Jersey at 59.9%, New Hampshire, Washington, New York State, New Mexico, Oregon, District of Columbia, Virginia, Colorado, Minnesota, California, Hawaii, Delaware, Pennsylvania, Wisconsin, Florida, Nebraska, Iowa and Illinois at 50.0%.
Next up (total population, fully vaccinated according to CDC) are Michigan at 49.7%, South Dakota at 48.1, Ohio at 47.5%, Kentucky at 47.0%, Kansas at 46.7%, Arizona at 46.6%, Alaska at 46.4%, Utah at 46.2%, and Nevada at 46.1%.
 Click on graph for larger image.
This graph shows the daily (columns) and 7 day average (line) of positive tests reported.
This data is from the CDC.